Demographic and general clinical data
Table 1 summarizes the demographic characteristics and general clinical data of the SCZ and HC groups. There were no significant differences between the groups in terms of age, gender, ethnicity, BMI, education level, marital status, family location, or smoking habits (all P > 0.05). For the SCZ participants, the mean age of onset was 22.43 ± 3.20 years, with a mean disease duration of 21.94 ± 7.13 years. Participants administered a mean chlorpromazine equivalent dose of 592.84 ± 164.90 mg/day and a lorazepam equivalent dose of 1.58 ± 0.70 mg/day.
Clinical characteristics of participants
In the SCZ group, patients exhibited a mean PANSS total score of 79.18 ± 11.07, with positive symptoms at 16.63 ± 3.43, negative symptoms at 26.71 ± 4.31, and general psychopathology symptoms at 35.84 ± 8.16. The PHQ-9 scores, GAD-7 scores, MoCA total scores, and scores of all sub-indexes for the 204 SCZ and 216 HC participants are presented in Table 2 and Supplementary Table 2, along with their respective means and standard deviations. Compared to the HC group, the SCZ group showed significantly lower MoCA total scores and all subscale scores (P < 0.001), indicating poorer cognitive function. Additionally, they exhibited higher levels of anxiety and depression (P < 0.001).
Plasma ferroptosis and OS parameters
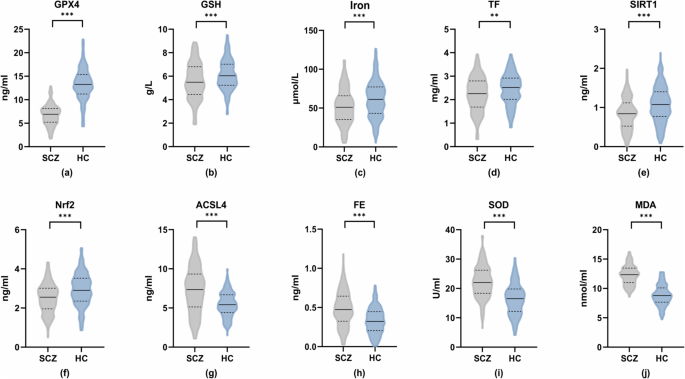
Figure 1a–j and Supplementary Table 3 summarize ferroptosis and OS-related indices in blood samples from both SCZ and HC participants. Significantly lower levels of GPX4 [(6.78 ± 2.24) ng/mL vs (13.28 ± 3.49) ng/mL, P < 0.001, Fig. 1a], GSH [(5.58 ± 1.57) g/L vs (6.12 ± 1.31) g/L, P < 0.001, Fig. 1b], Iron [(52.27 ± 23.03) μmol/L vs (61.31 ± 23.72) μmol/L, P < 0.001, Fig. 1c], TF [(2.23 ± 0.74) mg/mL vs (2.45 ± 0.67) mg/mL, P = 0.002, Fig. 1d], SIRT1 [(0.85 ± 0.41) ng/mL vs (1.08 ± 0.46) ng/mL, P < 0.001, Fig. 1e], and Nrf2 [(2.50 ± 0.76) ng/mL vs (2.94 ± 0.84) ng/mL, P < 0.001, Fig. 1f] were observed in the SCZ group compared to the HC group. Conversely, levels of ACSL4 [(7.33 ± 2.98) ng/mL vs (5.47 ± 1.59) ng/mL, Fig. 1g] and FE [(0.49 ± 0.23) ng/mL vs (0.33 ± 0.17) ng/mL, Fig. 1h] were significantly higher in the SCZ group (all P < 0.001). Regarding OS markers, plasma SOD [(22.26 ± 5.56) U/mL vs (16.36 ± 5.37) U/mL, Fig. 1i] and MDA [(12.27 ± 1.66) nmol/mL vs (8.87 ± 1.79) nmol/mL, Fig. 1j] were significantly elevated in the SCZ group compared to the HC group (all P < 0.001).
Panels (a) through (j) depict the concentration levels of the following biomarkers in both groups: a glutathione peroxidase 4 (GPX4), b glutathione (GSH), c iron, d transferrin (TF), e sirtuin 1 (SIRT1), f nuclear factor erythroid 2-related factor 2 (Nrf2), g acyl-CoA synthetase long-chain family member 4 (ACSL4), h ferritin (FE), i superoxide dismutase (SOD), and j malondialdehyde (MDA). **P < 0.01; ***P < 0.001.
Association between ferroptosis and OS markers
Within the SCZ group, the correlation analysis presented in Table 3 revealed several significant relationships between ferroptosis and OS markers. ACSL4 exhibited negative correlations with SIRT1 (r = −0.23, P < 0.001) and Nrf2 (r = −0.17, P < 0.05), while showing positive correlations with SOD (r = 0.18, P < 0.05) and MDA (r = 0.23, P < 0.001). Conversely, GPX4 demonstrated positive correlations with SIRT1 (r = 0.19, P < 0.01) and Nrf2 (r = 0.17, P < 0.05), and negative correlations with SOD (r = −0.14, P < 0.05) and MDA (r = −0.33, P < 0.001). Additionally, GSH displayed a positive correlation with SIRT1 (r = 0.19, P < 0.01) and a negative correlation with MDA (r = −0.29, P < 0.001), but no significant correlations with SOD and Nrf2 (P > 0.05). TF showed no significant associations with SIRT1, Nrf2, or SOD (P > 0.05) but displayed a negative correlation with MDA (r = −0.21, P < 0.01). Similarly, FE lacked significant correlations with SIRT1, Nrf2, and MDA (P > 0.05) but showed a positive correlation with SOD (r = 0.18, P < 0.01). Finally, iron levels were not significantly associated with any of the other markers (SIRT1, Nrf2, SOD, and MDA; P > 0.05).
Correlation of psychiatric symptoms and negative emotions with indicators related to ferroptosis and OS
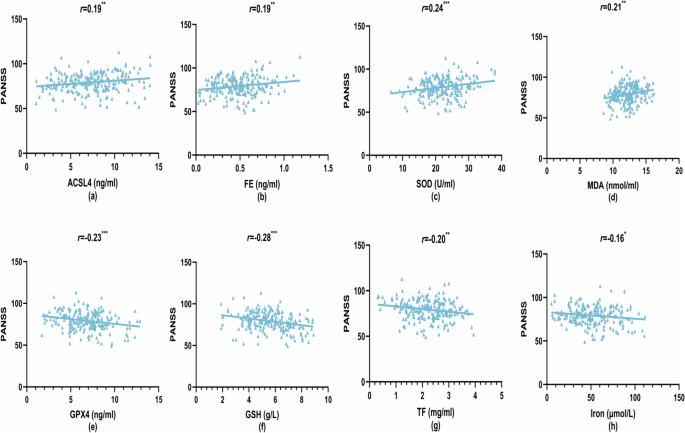
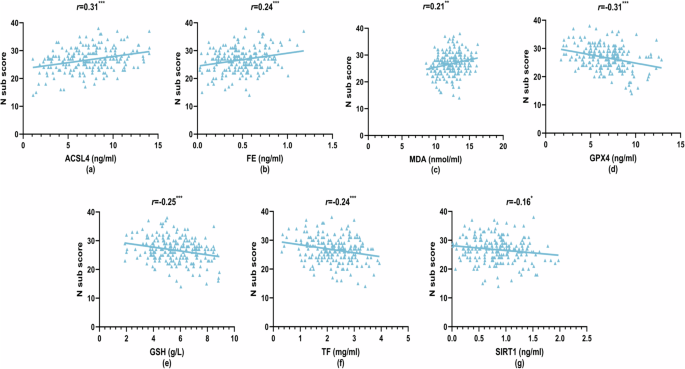
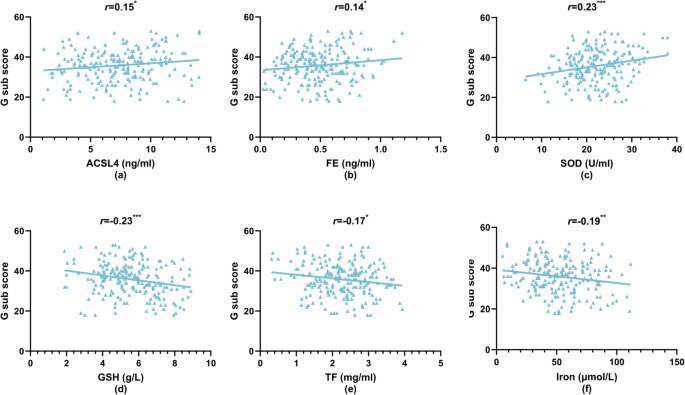
Within the SCZ group, Pearson’s correlation analysis was conducted to examine relationships between ferroptosis and OS markers with PANSS and its subscale scores, depression (PHQ-9), and anxiety (GAD-7) scores (Figs. 2–4 and Supplementary Table 4). The total PANSS score showed positive correlations with plasma ACSL4 (r = 0.19, P < 0.01), FE (r = 0.19, P < 0.01), SOD (r = 0.24, P < 0.001), and MDA (r = 0.21, P < 0.01) levels [Fig. 2a–d], and negative correlations with GPX4 (r = −0.23, P < 0.001), GSH (r = −0.28, P < 0.001), TF (r = −0.20, P < 0.01), and iron levels (r = −0.16, P < 0.05) [Fig. 2e–h]. Similar patterns of correlations were observed for negative symptoms, with positive correlations for ACSL4 (r = 0.31, P < 0.001), FE (r = 0.24, P < 0.001), and MDA (r = 0.21, P < 0.01) [Fig. 3a–c], and negative correlations for GPX4 (r = −0.31, P < 0.001), GSH (r = −0.25, P < 0.001), TF (r = −0.24, P < 0.001), and SIRT1 (r = −0.16, P < 0.05) [Fig. 3d–g]. General psychopathology symptoms also exhibited positive correlations with ACSL4 (r = 0.15, P < 0.05) and FE (r = 0.14, P < 0.05) levels, and a positive correlation with SOD (r = 0.23, P < 0.001) [Fig. 4a–c]. Conversely, negative correlations were observed for GSH (r = −0.23, P < 0.001), TF (r = −0.17, P < 0.05), and iron (r = −0.19, P < 0.01) [Fig. 4d–f]. iron level was negatively correlated with positive symptoms (r = −0.17, P < 0.05), while other indices did not show significant correlations with positive symptoms (P > 0.05). Depression (PHQ-9) scores only showed a negative correlation with GSH (r = −0.16, P < 0.05), while neither PHQ-9 nor GAD-7 scores exhibited significant correlations with any other ferroptosis or OS markers (P > 0.05). No significant differences in plasma ferroptosis and OS markers from anxiety and depression in the HC Group (Supplementary Table 5, P > 0.05).
a Acyl-CoA synthetase long-chain family member 4 (ACSL4) levels vs PANSS scores, b ferritin (FE) levels vs PANSS scores, c superoxide dismutase (SOD) levels vs PANSS scores, d malondialdehyde (MDA) levels vs PANSS scores, e glutathione peroxidase 4 (GPX4) levels vs PANSS scores, f glutathione (GSH) levels vs PANSS scores, g transferrin (TF) levels vs PANSS scores, and h iron levels vs PANSS scores. *P < 0.05; **P < 0.01; ***P < 0.001.
a Acyl-CoA synthetase long-chain family member 4 (ACSL4) levels vs N sub scores, b ferritin (FE) levels vs N sub scores, c malondialdehyde (MDA) levels vs N sub scores, d glutathione peroxidase 4 (GPX4) levels vs N sub scores, e glutathione (GSH) levels vs N sub scores, f transferrin (TF) levels vs N sub scores, and g sirtuin 1 (SIRT1) levels vs N sub scores. *P < 0.05; **P < 0.01; ***P < 0.001.
a Acyl-CoA synthetase long-chain family member 4 (ACSL4) levels vs G sub scores, b ferritin (FE) levels vs G sub scores, c superoxide dismutase (SOD) levels vs G sub scores, d glutathione (GSH) levels vs G sub scores, e transferrin (TF) levels vs G sub scores, and f iron levels vs G sub scores. *P < 0.05; **P < 0.01; ***P < 0.001.
Correlation of cognitive performance with indicators related to ferroptosis and OS
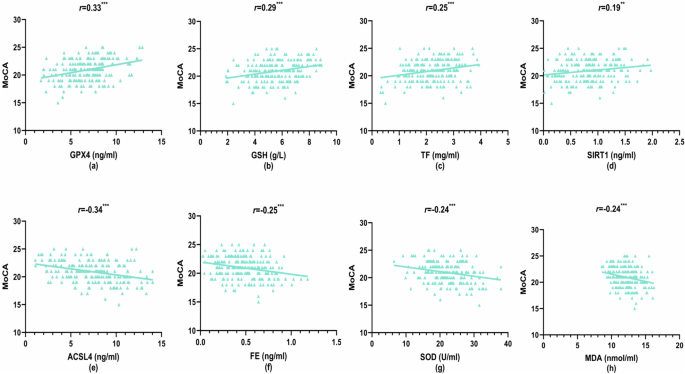
First, in the HC group, the results showed no significant correlation between ferroptosis and OS indicators and cognitive function (Supplementary Table 5, P > 0.05). Then, In the SCZ group, there were no significant differences in cognitive function based on gender, age, antipsychotic medications, or benzodiazepine use (Supplementary Tables 6 and 7, P > 0.05). Finally, analysis of the data in Supplementary Table 8 and Fig. 5a–h revealed significant correlations between ferroptosis and OS markers with MoCA total score and its subscale scores. MoCA total score showed positive correlations with GPX4 (r = 0.33, P < 0.001), GSH (r = 0.29, P < 0.001), TF (r = 0.25, P < 0.001), and SIRT1 (r = 0.19, P < 0.01) levels, while negative correlations were observed with ACSL4 (r = −0.34, P < 0.001), FE (r = -0.25, P < 0.001), SOD (r = −0.24, P < 0.001), and MDA (r = −0.24, P < 0.001) [Fig. 5a–h]. Similar patterns of correlations emerged for MoCA subdomains. Visuospatial and executive function scores positively correlated with GSH (r = 0.28, P < 0.001) and iron levels (r = 0.21, P < 0.01). Attention scores showed positive correlations with GSH (r = 0.18, P < 0.01) and SIRT1 (r = 0.17, P < 0.05). Language function scores positively correlated with GPX4 (r = 0.24, P < 0.001) and TF (r = 0.15, P < 0.05). Abstraction scores showed a positive correlation with GPX4 (r = 0.31, P < 0.001) and negative correlations with ACSL4 (r = −0.21, P < 0.01), SOD (r = −0.25, P < 0.001), and MDA (r = −0.17, P < 0.05). Delayed memory scores positively correlated with GPX4 (r = 0.21, P < 0.01) and negatively correlated with ACSL4 (r = −0.20, P < 0.01) and MDA (r = −0.22, P < 0.01). Orientation only negatively correlated with ACSL4 levels (r = −0.14, P < 0.05).
a Glutathione peroxidase 4 (GPX4) levels vs MoCA scores, b glutathione (GSH) levels vs MoCA scores, c transferrin (TF) levels vs MoCA scores, d sirtuin 1 (SIRT1) levels vs MoCA scores, e acyl-CoA synthetase long-chain family member 4 (ACSL4) levels vs MoCA scores, f ferritin (FE) levels vs MoCA scores, g superoxide dismutase (SOD) levels vs MoCA scores, and h malondialdehyde (MDA) levels vs MoCA scores. **P < 0.01; ***P < 0.001.
Multiple linear regression analysis of psychiatric symptoms
Three multiple linear regression models were developed to investigate the relationships between ferroptosis and OS markers with PANSS total score, negative symptoms, and general psychopathology symptoms (dependent variables). The models included statistically significant parameters from the correlation analysis as independent variables (Tables 4 and 5 and Supplementary Table 9). For the total PANSS score, the regression analysis revealed a negative association with GSH (β = −0.15, P = 0.030) and iron (β = −0.13, P = 0.043), a positive association with SOD (β = 0.17, P = 0.015), and no significant associations with ACSL4, GPX4, FE, TF, and MDA (P > 0.05; Table 4). Negative symptoms exhibited positive regression coefficients with ACSL4 (β = 0.18, P = 0.007) and FE (β = 0.19, P = 0.004), and a negative coefficient with GPX4 (β = −0.19, P = 0.006). No significant associations were observed with GSH, TF, SIRT1, or MDA (P > 0.05; Table 5). Conversely, general psychopathology symptoms showed negative associations with GSH (β = −0.15, P = 0.031) and iron (β = −0.17, P = 0.014), a positive association with SOD (β = 0.18, P = 0.009), and no significant associations with ACSL4, FE, or TF (P > 0.05; Supplementary Table 9).
Multiple linear regression analysis of cognitive performance
A multiple linear regression model was employed to investigate the association between ferroptosis and OS markers with cognitive function in the SCZ group, using the MoCA total score as the dependent variable. The model included age and statistically significant parameters from the correlation analysis as independent variables (ACSL4, GPX4, GSH, FE, TF, SIRT1, SOD, and MDA). The results revealed that lower GPX4 levels (β = 0.19, P = 0.005) and higher levels of ACSL4 (β = −0.18, P = 0.007) and FE (β = −0.16, P = 0.012) were significantly associated with lower MoCA scores, indicating greater cognitive dysfunction. No significant associations were observed with the remaining markers (P > 0.05; Table 6). Similar regression analyses were conducted for each MoCA subscale. Abstraction displayed a positive correlation with GPX4 (β = 0.24, P < 0.001) and a negative correlation with SOD (β = −0.20, P = 0.003) (Supplementary Table 10). Language function only showed a significant positive correlation with GPX4 (β = 0.21, P = 0.003) (Supplementary Table 11). No significant correlations were found between delayed memory and MDA, ACSL4, or GPX4 (all P > 0.05) (Supplementary Table 12). Visuospatial and executive function scores showed positive correlations with GSH and iron levels (β = 0.26, P < 0.001; β = 0.18, P = 0.008) (Supplementary Table 13). Finally, attention scores displayed positive correlations with both GSH (β = 0.16, P = 0.028) and SIRT1 (β = 0.15, P = 0.033) (Supplementary Table 14).

