
This section reflects the structure of the work (initial experimental data analysis, clustering output, model validation, model-based extraction of human neuropsychological features, model-based therapeutic predictions) and then proposes multiple data analyses. In particular, we propose primary analyses (behavioural assessment, clustering output, and model-based neuropsychological profiling of groups), secondary analyses (e.g., analyses of individual participant models), and exploratory analyses (analysis of the ‘PE-NPE balance’ and outcomes of simulated therapeutic interventions).
Experimental data of the control and clinical groups
Patients (n = 162) show statistical differences compared to the control group (N = 108) across all the WCST indices (Table 2).
In particular, the clinical sample shows lower CC (3.4 ± 2.1 VS 5.8 ± 0.6, t = 11.56, Cohen’s d = 1.55, p < 0.001), higher PE (27.9 ± 18.5 VS 9.0 ± 7.0, t = 10.14, Cohen’s d = 1.35, p < 0.001), higher NPE (20.5 ± 11.2 VS 8.8 ± 7.2, t = 9.61, Cohen’s d = 1.24, p < 0.001), and higher FMS (1.6 ± 2.0 VS 0.2 ± 0.5, t = 7.12, Cohen’s d = 0.96, p < 0.001).
The clustering algorithm found three performance-dependent clinical sub-populations, namely ‘Relatively Intact patients’ (RI), ‘Moderately Impaired patients’ (MI), and ‘Severely Impaired patients’ (SI).
Although the dataset we used here is slightly reduced than the one we used in31, it kept the same between-group proportions (Fig. 3).
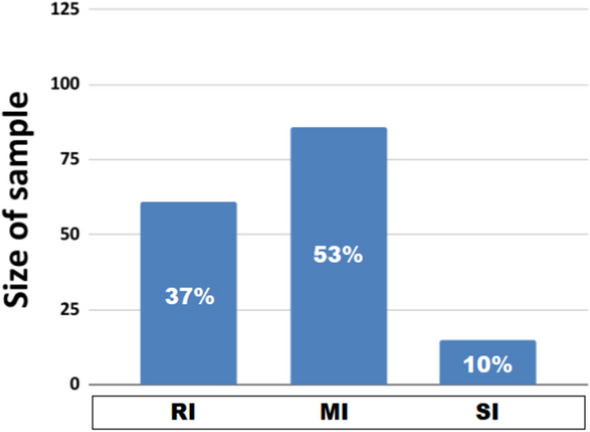
Sample sizes of the patient sub-groups. RI: Relatively Intact. MI: Moderately Impaired. SI: Severally Impaired. The in-column number refers to the group percentage of the entire clinical group.
In particular, the RI group (n = 61) represents 37 % of patients, the MI group (n = 86) represents 53 % of them, and the SI group (n = 15) represents 10 % of them. We expected the unbalanced sample sizes and, in particular, the small SI sample size due to (1) the unsupervised clustering algorithm and (2) previous tests on different sample sizes of subpopulations31
Clinical sub-groups show a high behavioural variability (Table 3). Indeed, both them and the control group show statistical differences (for a complete list of post-hoc analyses, see Tables S1–S4 in Supplementary Materials). However, some of them show similar indices (Fig. 4).
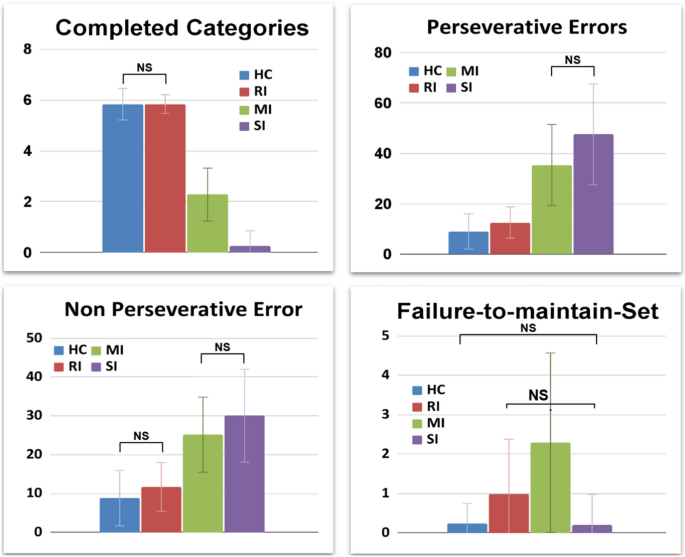
Behavioural data of healthy/control and patient sub-groups. NS: not significant statistical difference.
For example, the healthy control (HC) and RI groups do not show statistically different CC (5.8 ± 0.6 VS 5.84 ± 0.37, t = 0.47, Cohen’s d = 0.08, p = 3.83). The MI and SI groups show non-statistically different PE (35.44 ± 16.04 VS 47.53 ± 20.05, t = 2.59, Cohen’s d = 0.66, p= .07). The NPE is non-statistically different between the control group and RI (8.8 ± 7.2 VS 11.71 ± 6.27, t = 2.64, Cohen’s d = 0.43, p = .05), and between the MI and SI (25.15 ± 9.67 VS 30.07 ± 11.94, t = 1.75, Cohen’s d = 0.45, p = .50). Finally, the FMS is non-statistically different between the control group and SI groups (0.2 ± 0.5 VS 0.20 ± 0.78, t = 0.00, Cohen’s d = 0.00, p = 6.00) and between RI and SI groups (0.98 ± 1.40 VS 0.20 ± 0.78, t = 2.07, Cohen’s d = 0.69, p = 0.25).
We performed a power analysis (with software GPower 3.1.9.7) that took in consideration all behavioural indices and the between-group comparisons (control-clinical groups): HC vs RI (Cohen’s d = 0.67, \(\alpha\) = 0.05; Power 1–\(\beta\): 0.99), HC vs MI (Cohen’s d = 2.36, \(\alpha\) = 0.05; Power 1–\(\beta\): 1.00), HC vs SI (Cohen’s d = 0.8, \(\alpha\) = 0.05; Power 1–\(\beta\): 1.00). All differences observed in the sample show high statistical power (Power > 0.90), supporting the robust results emerging from the cluster analysis.
Modelling experimental data of the control group and patient clusters
The structure of this section aims to investigate the functioning of the model and to validate it. Furthermore, it represents the starting point to offer a model-based analysis of the cognitive profile of the participants. The first section illustrates an initial fitting operation, in which we try to reproduce the experimental data of the participants with the original model (without interfering IS), thus obtaining suboptimal performances for MI and SI populations. The second section illustrates a sensitivity analysis in which we progressively increase the I-IS weight and investigate the subsequent behavioural effect on the model (WCST indices). The last section illustrates a second validation operation, in which we compute the fitting performances (BIC) related to each previous simulation. This last validation achieved impressive performances, leading the model to reproduce even the WCST indices of MI and SI participants with different I-IS weights.
Initial fitting: model-human comparisons
The model reproduces the behavioural trends and behavioural indices of the corresponding human groups (Fig. 5; for the parameter sets of this initial fitting operation see Table S5 in Supplementary Materials).
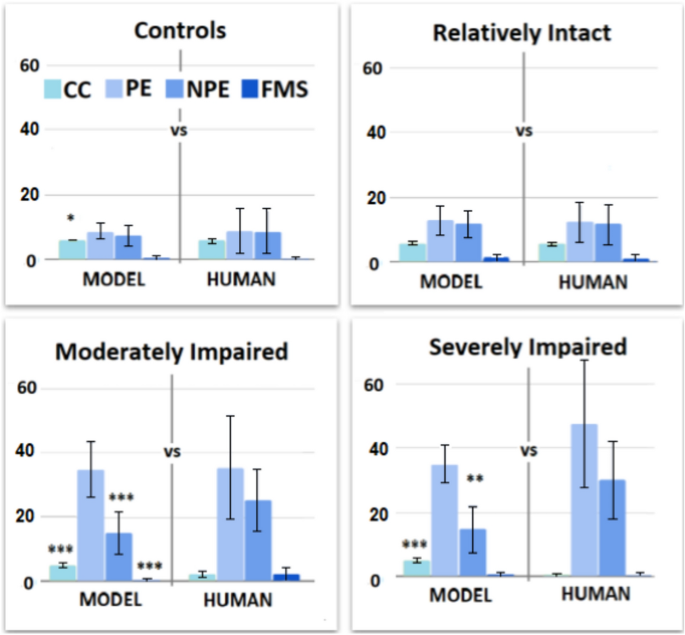
Behavioural comparisons (Models-Humans). Behavioural profiles of models and corresponding human groups.
The control model shows a slight statistical difference for CC (6.00 ± 0.00 VS 5.83 ± 0.62, t = 2.85, Cohen’s d = 0.39, p = 0.03, p < .05) but no other significant differences in PE (9.01 ± 7.00 VS 8.74 ± 2.32, t = 0.3805, Cohen’s d = 0.05, p = 4.23), NPE (8.82 ± 7.15 VS 7.49 ± 3.21, t = 1.76, Cohen’s d = 0.24, p = .48), FMS (0.23 ± 0.52 VS 0.38 ± 0.65, t = 1.87, Cohen’s d = 0.25, p = .38).
The RI model shows no significant differences in CC (5.84 ± 0.37 VS 5.87 ± 0.42, t = 0.42, Cohen’s d = 0.08, p = 4.06), PE (12.53 ± 6.23 VS 12.92 ± 4.47, t = 0.40, Cohen’s d = 0.07, p = 4.15), NPE (11.71 ± 6.27 VS 11.79 ± 4.22, t = 0.08, Cohen’s d = 0.01, p = 5.61), FMS (0.98 ± 1.40 VS 1.21 ± 1.22, t = 0.97, Cohen’s d = 0.18, p = 2.01).
The MI model shows statistical differences in CC (5.19 ± 0.8 VS 2.28 ± 1.04, t = 20.57, Cohen’s d = 3.14, p < .001), NPE (15.09 ± 6.68 VS 25.15 ± 9.67, t = 7.94, Cohen’s d = 1.21, p < .001) and FMS (0.26 ± 0.49 VS 2.29 ± 2.28, t = 8.07, Cohen’s d = 1.23, p < .001). However, it shows no significant difference in PE (35.44 ± 16.04 VS 34.92 ± 8.59, t = 0.27, Cohen’s d = 0.04,p = 4.75).
The SI model shows statistical differences in CC (5.27 ± 0.68 VS 0.27 ± 0.59, t = 21.51, Cohen’s d = 7.85, p < .001) and NPE (14.73 ± 7.08 VS 30.07 ± 11.94, t = 4.28, Cohen’s d = 1.56, p= .0012, p < .01). However, it shows no significant differences in PE (47.53 ± 20.05 VS 34.93 ± 5.63, t = 2.34, Cohen’s d = 0.86, p = 1.58) and FMS (0.20 ± 0.78 VS 0.53 ± 0.72, t = 1.20, Cohen’s d = 0.44, p = 1.43).
In general, the control and RI models reproduce mostly indices and behavioural trends of the corresponding human groups. However, the MI and SI models reproduce only specific trends (PE/NPE balance) and human indices (e.g., PE). Therefore, this first fitting achieves a sub-optimal result (for further details see Table S6 in Supplementary Materials).
Behavioural effects of the IS alteration
The inner-speech alteration has a similar effect on WCST scores across all models, with some model-specific trend differences (Fig. 6). In particular, the alteration leads to a decrease in CC and an increase in PE, NPE and FMS. However, the groups show partially different alteration magnitudes (e.g., see the PE box of Fig. 6) and slopes (e.g., see the FMS box of Fig. 6). Overall, the IS alteration interferes with the baseline performance of the models (see Tables S7–S10 in Supplementary Materials).
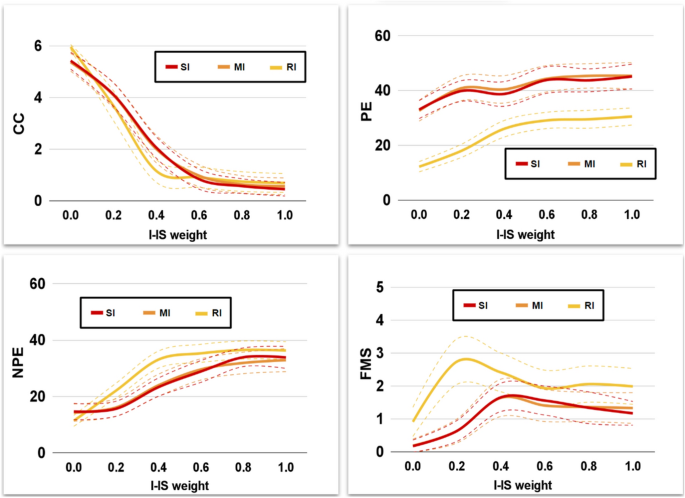
Behavioural effects of Interfering-IS. Behavioural indices of clinical models after an Interfering-IS injection.
Second fitting: reproducing the human data with an Interfering-IS
Different magnitudes of the Interfering-IS lead to models with different fitting performance (Fig. 7).
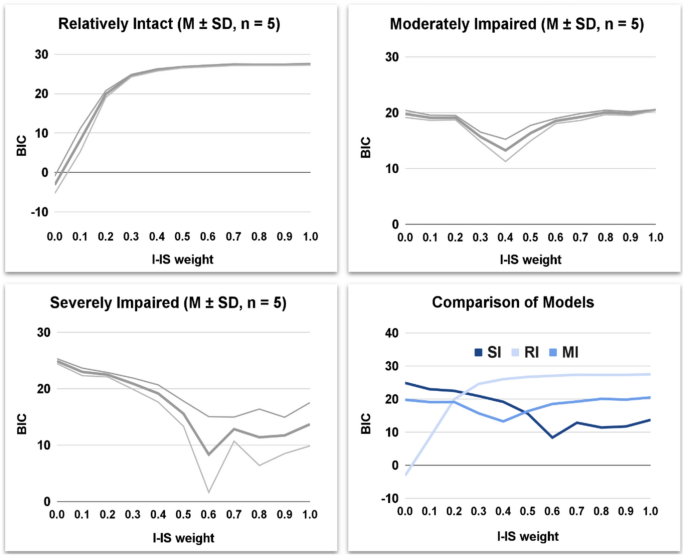
BIC and Interfering-IS relationship. Fitting performance (BIC) of clinical models with an Interfering-IS injection.
The Interfering-IS does not improve the fitting performance of the RI model, which already fits all human indices without Interfering-IS. However, the Interfering-IS introduction leads the MI and SI models to fit all human indices (Fig. 8; for an exhaustive statistical comparison see tables S11–S18 in Supplementary Materials). Indeed, both models achieve a much lower BIC after the alteration.
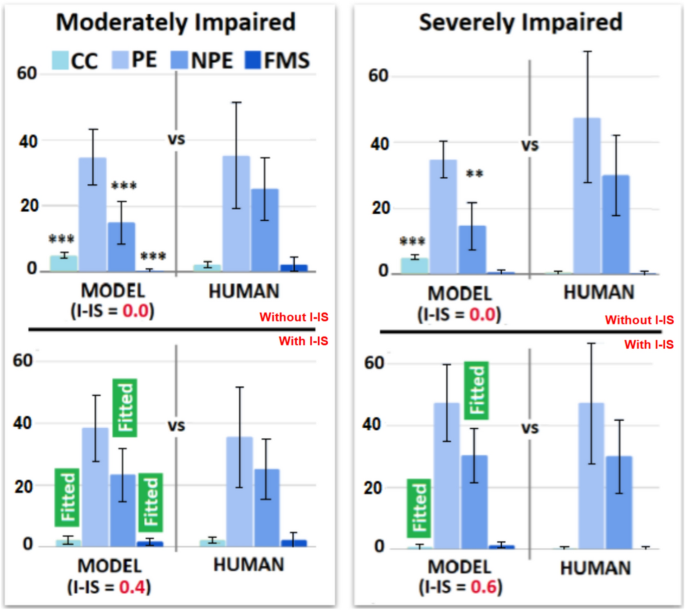
Behavioural profiles of the IS and Interfering-IS models. The upper plots show the results obtained from the first validation (model without I-IS), which show suboptimal performance (e.g., some WCST indices are not fitted). The lower plots show the results obtained from the second validation (model with I-IS), which show optimal performance. The labels ‘Fitted’ highlight WCST indices that are fitted in the second validation due to the Interfering-IS introduction.
Model-based human group comparisons
Computational methods support model-based profiling of cognitive and behavioural features of human groups. Therefore, here we show between-model comparisons to highlight between-groups human differences.
Cognitive comparisons
Group-dependent cognitive trends and profiles emerge (Fig. 9).
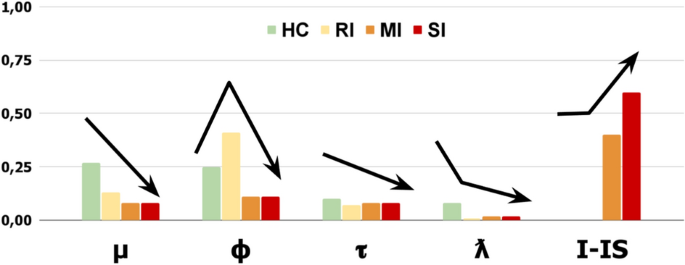
Parameters of the fitted models. Parameter trends of the models.
The ‘Error Sensitivity’ (\(\mu\)) shows a severity-based decreasing trend. In particular, the control group shows the highest value (0.27), and clinical groups show gradually lower values (RI: 0.13, MI: 0.08, SI: 0.08). The ‘Memory refresh/Forgetting speed’ (\(\phi\)) shows an ‘irregular severity-based decreasing trend’. The RI group shows the highest value (0.41); however, the control group shows a higher value (0.25) than the MI/SI groups (0.11). The ‘Exploratory tendency/Distractibility’ (\(\tau\)) shows a slightly descending trend. The control group shows a higher value (0.10) compared to the RI group (0.07) and the MI/SI groups (0.08). The ‘Inner-Speech contribution’ (\(\lambda\)) shows a strongly descending trend. The control group shows the highest value (0.08) compared to mostly null value of the RI group (0.01) and the MI/SI groups (0.02). Notably, the ‘Interfering Inner-speech weight’ (I-IS) shows a severity-based increasing trend. In particular, the control and RI groups show no IS interference, while the MI group shows a medium value (0.4) and the SI group shows the highest value (0.6).
Overall, the groups show evident severity-based trait trends with some exceptions (e.g., Memory refresh). Interestingly, an increasing Interfering-IS weight specifically differentiates the MI and SI groups.
Behavioural comparisons
The control group shows statistically higher performance compared to clinical groups (Table 4, box A of Fig. 10).
However, macro-similarities emerge between the control and the RI groups and between the MI and the SI groups (box B of Fig. 10; for a complete post-doc analysis see Tables 19–22 in Supplementary Materials).
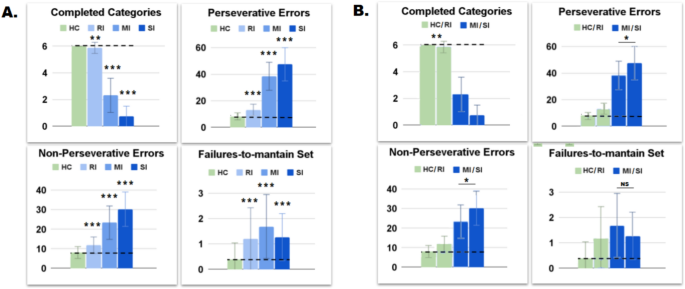
Behavioural trends of models. A: group-dependent descending behavioral trends. B: macro-similarities in Control-RI models and MI-SI models.
For example, the control and RI groups show statistical difference in CC (HC: 6.00 ± 0.00 VS 5.87 ± 0.42, t = 3.22, Cohen’s d = 0.44, p = .009, p < .01). However, they show very similar values and the statistical difference is due to a zero standard deviation of the HC group. The MI and SI groups show slightly different PE (38.43 ± 10.54 VS 47.47 ± 12.51, t = 2.98, Cohen’s d = 0.78, p = .02, p < .05) and NPE (23.34 ± 8.56 VS 30.27 ± 8.81, t = 2.88, Cohen’s d = 0.80, p = .03, p < .05), but they are not significantly different in FMS score (1.69 ± 1.26 VS 1.27 ± 0.93, t = 1.23, Cohen’s d = 0.38, p = 1.33). Control and SI groups unexpectedly show different FMS score (0.39 ± 0.65 VS 1.27 ± 0.93, t = 4.64, Cohen’s d = 1.10, p < .001) than their human counterparts, probably due to a difference-stretching effect performed by the model.
Therefore, although there are clustering-dependent differences, the RI group shows a behavioural profile more similar to the control group. Furthermore, the MI group shows a behavioural profile more similar to the SI group.
PE vs. NPE in control and patient sub-groups. PE and NPE reflect two key opposite neuropsychological trends, that is, perseveration and distraction1. For example, their balance could identify specific human neuropsychological profiles (e.g., Autism;20). Therefore, we applied these explorative analysis to the participants of this study.
The control and clinical groups show peculiar PE/NPE balances (Fig. 11).
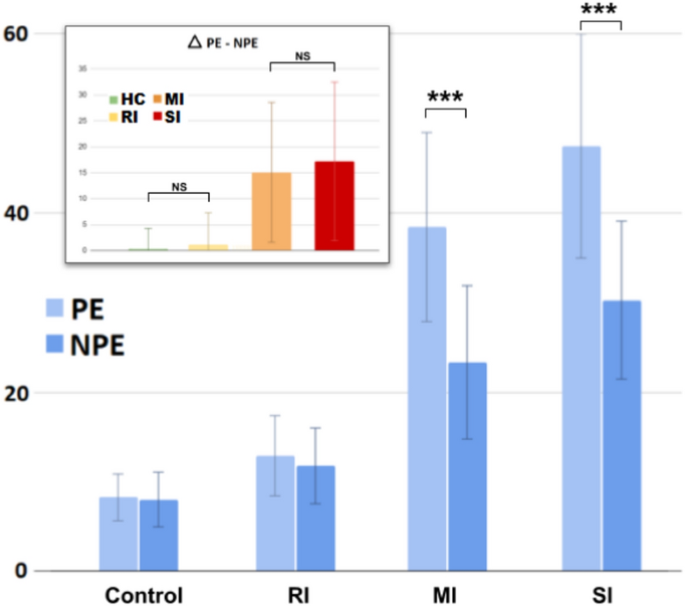
PE/NPE tendencies. Statistical difference between PE and NPE across the groups. The top-left panel reports the PE-NPE difference \(\Delta\).
The HC group shows a comparable number of PE and NPE (\(8.27 \pm 2.61\) vs \(8.03 \pm 3.05\), t = 0.62, Cohen’s d = 0.08, p = 3.21). Similarly, the RI group shows a comparable number of PE and NPE (\(12.92 \pm 4.47\) vs \(11.79 \pm 4.22\), t = 1.44, Cohen’s d = 0.26, p = .92). The MI group shows significantly higher PE than the NPE (\(38.43 \pm 10.54\) vs \(23.34 \pm 8.56\), t = 10.31, Cohen’s d = 1.57, p < .001). Similarly, the SI group shows higher PE than the NPE (\(47.47 \pm 12.51\) vs \(30.27 \pm 8.81\), t = 4.35, Cohen’s d = 1.59, p = .0012, p < .01).
Overall, Fig. 11 (top-left box) shows the differences between PE and NPE (\(\Delta\) PE-NPE) across the groups (for further details see table S23 in Supplementary Materials). The HC and RI groups show a comparable and almost null value (\(0.35 \pm 3.50\) VS \(1.13 \pm 0.79\), t = 1.71, Cohen’s d = 0.31, p = .53). The MI and SI groups show a comparable and high value (\(15.09 \pm 13.54\) VS \(17.2 \pm 15.30\), t = 0.55, Cohen’s d = 0.15, p = 3.52). Therefore, the HC and RI groups show no PE-NPE imbalance, while the MI and SI groups show the same higher imbalance toward PE.
Internal functioning: single-model analysis
Previous sections have illustrated model-based analyses of the neurocognitive and behavioural features of human groups. Here we analyse the internal processes of the models that reproduce a single participant for each group (Fig. 12).
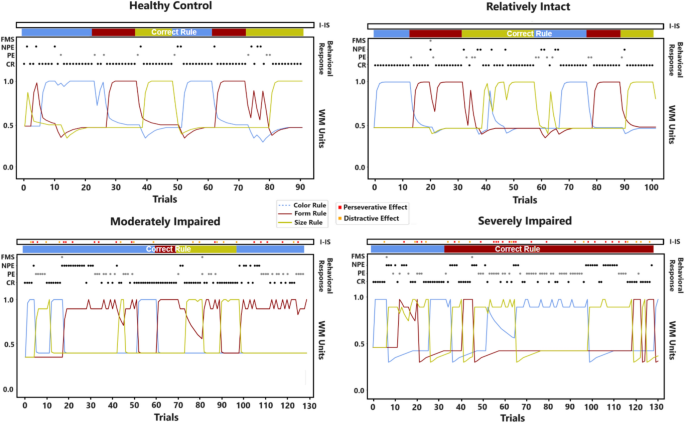
Internal functioning each of the four single models. The plots show a ‘single-participant’ view of the models. From the top of each plot: activation/effect of the Inner-Speech component (‘I-IS’), the rule that the model should chooses for each trial (‘Correct Rule’), the scored behavioural response of the model (FMS, NPE, PE, CR), the internal activation of the working-memory (rule priorities, 0–1).
The HC participant (Fig. 12, top-left plot) adequately performs the task, however, showing some fallacious processes and responses. In particular, it performs adequate reasoning-by-exclusion processes (e.g., trials 0–10 and trials 50–60). However, it shows some attentional failures leading to NPE/FMS (e.g., transient incorrect rule changes; see trials 8 to 15). Moreover, it sometimes shows perseverative tendencies (PE; trials 20–30) and reasoning-by-exclusion process failures leading to both PE and NPE (e.g., trials 73–83). Overall, the participant demonstrates the ability to re-track the correct rule after these failures.
The RI participant (Fig. 12, top-right plot) successfully completes the task, even if showing several distracted/irrational behaviours. In particular, it performs few adequate rule changes (trials 10–20), also showing trends of sustained efficient responses with few errors (trials 70–100 trials). However, it shows many attentional failures (NPE and FMS; trials 20–27 or trials 46–52). Moreover, it often shows severe incorrect rule changes due to impaired reasoning-by-exclusion processes (PE and NPE; trials 34–42 or trials 60–70).
The MI participant (Fig. 12, bottom-left plot) shows sparse adequate responses (e.g., trials 48–73) but inadequate overall performance; in fact, it fails the task. In particular, it shows attentional failures followed by perseverative responses (trials 1–10 trials or trials 78–88 trials). Moreover, it shows severe perseverative tendencies after incorrect rule changes (trials 18–43), thus leading to both PE and NPE (trials 95–125). Note that the Interfering-IS effect causes attentional failures and subsequent perseverative trends.
The SI participant (Fig. 12, bottom-right plot) mostly shows inadequate responses; indeed, it fails the task. In particular, it shows attentional failures leading to perseverative responses (trials 9–23 or trials 43–72) and severe perseverative trends that also lead to NPE (trials 43–72). Also in case of partially successful rule changes, they result inefficient and lead to NPE (trials 32–39). Note that the Interfering-IS effect mainly causes perseverative trends and also leads to NPE (trials 78–115).
Overall, these results corroborate a group-based descending performance. However, the MI/SI participants show similar deficits (persistent perseverative trends). On the other hand, the RI participant produces a plot similar to the control participant, however showing more attentional failures/distractions rather than perseveration tendencies. At last, these plots highlight that the Interfering-IS causes both perseveration tendencies and attentional failures.
IS-based therapeutic intervention across the groups.
Here we propose exploratory analyses and predictions on a simulated psychotherapeutic intervention (for further data and analyses see tables S24–S28). The simulated intervention has similar improving effects across the clinical groups (Fig. 13, top boxes).
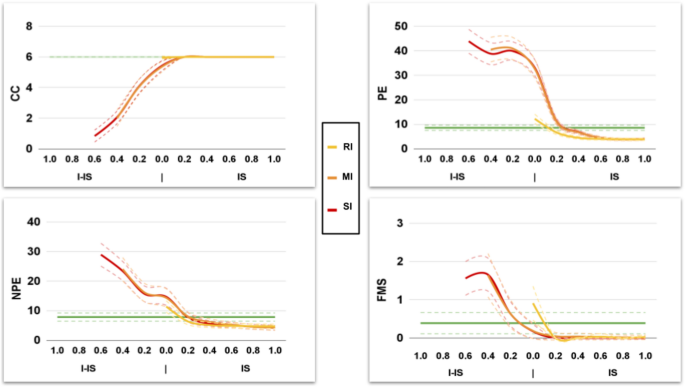
Effects of an IS-based psychotherapeutic intervention. Trends describing the effect of the intervention based on the patient sub-population. The green line shows the value of the control model.
In particular, simulated training sessions (for details, see section 2.3.3) increase the CC, and decrease the PE, NPE, and FMS. However, the groups show different trends and reach control performance at different times (Table 5). The RI group does not show Interfering-IS and requires a minimum potentiation of the IS (0 to 0.1), in particular, only 1 training session to reach the control performance. The MI group requires the recovery of a middle Interfering-IS effect (0.4 to 0) and a higher potentiation of IS (0 to 0.3), thus requiring 7 training sessions to reach the control performance. The SI group requires the recovery of the highest Interfering-IS effect (0.6 to 0) and a high potentiation of the IS (0 to 0.3), thus requiring the most prolonged training intervention (9 training sessions) to reach the control performance.
Overall, the groups show an increasing severity-dependent training time to reach the control performance. Interestingly, the RI model requires little training time to achieve the control performance.

